
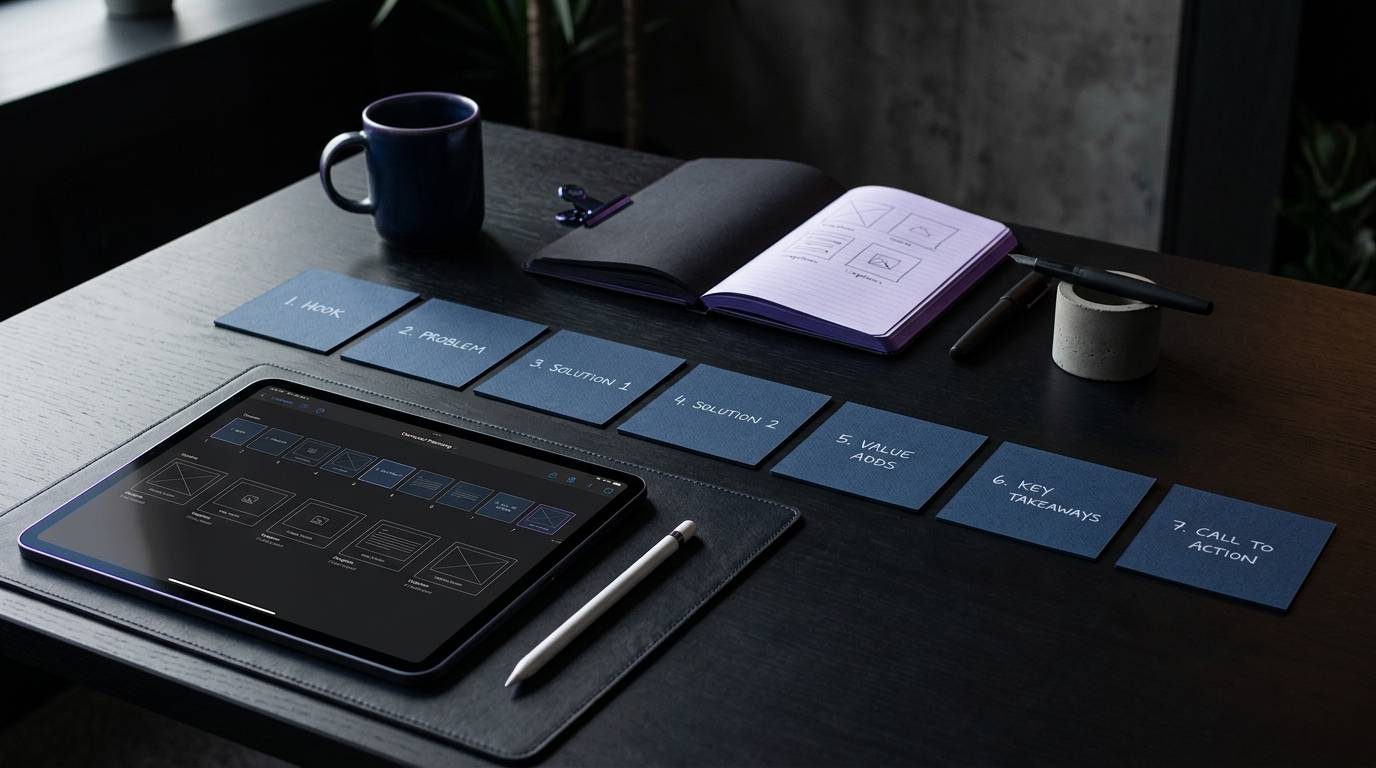
A social media carousel is not an arbitrary gallery of loose images or a collection of standalone graphics. It is an ordered editorial sequence designed to communicate a single structured concept across multiple swipeable cards. When planned with intention, a carousel helps a reader understand a complex topic, examine evidence, compare practical choices, or complete a multi-step task.
A social media carousel delivers maximum value when it guides the audience through an intentional sequence with a clear beginning, middle, and end. Planning the narrative progression, slide jobs, and accessibility requirements before opening a design canvas saves time and prevents disjointed posts.
Key takeaways
- Anchor every carousel around one clear audience, one primary concept, and one concrete outcome rather than packing multiple topics into one deck.
- Assign a distinct, non-overlapping editorial job to each slide so every card actively advances the reader through the narrative arc.
- Plan visual hierarchy, copy density, and accessibility standards, including a 4.5:1 text contrast ratio, before producing final graphics.
- Separate the roles of slide copy and post captions so the graphic remains readable on mobile screens while the caption provides supporting context.
- Verify platform specifications and publishing limits, recognizing that native mobile apps, publishing tools, and document uploads have unique constraints.
What is a social media carousel and when should you use one?
A carousel is an interactive multi-panel social media post format. It allows users on networks like Instagram and LinkedIn to swipe or click through a horizontal series of visual frames. On Instagram, carousels consist of a sequential collection of images or videos. On LinkedIn, carousels are often published as uploaded PDF document posts that render as swipeable pages within the feed.
A carousel is not inherently superior to a single-image graphic, a text update, or a short video. It earns its format complexity only when your message requires progression. If a message can be communicated clearly in a single sentence or a lone screenshot, forcing it into a multi-slide deck introduces unnecessary friction.
Carousels work best when your content requires:
- A sequential process or step-by-step tutorial where each phase builds upon the previous step.
- A conceptual comparison where distinct options must be evaluated against standard criteria.
- A deep teardown or case breakdown that requires background context, execution steps, and practical takeaways.
- A nuanced argument where an initial claim must be supported by empirical evidence, counter-arguments, and qualifications.
- A categorized reference list or checklist that users need to review, save, and reference later.
When you treat a carousel as a short visual document, you respect your reader’s attention. Planning your editorial calendar with intentional formats prevents post fatigue. You can organize these recurring formats inside your weekly content planning checklist to keep your publishing schedule structured and sustainable.
How do you define the core idea and content promise before designing?
The primary cause of an ineffective carousel is thematic sprawl. When a creator attempts to address three separate problems across eight slides, the narrative collapses. Before drafting any slide copy or opening a layout tool, you must define the editorial boundaries of the asset.
The three core questions
Every successful carousel brief answers three specific questions:
- What is the single problem or question this asset addresses?
- What specific knowledge, skill, or perspective will the reader possess after viewing the final card?
- What prior knowledge does the reader need to understand the material?
If you cannot express the topic in a single concise sentence, the scope is too wide. Split broad topics into smaller, self-contained installments rather than diluting the message.
Drafting the content promise
A content promise is your internal contract with the reader. It defines the value proposition of the post and dictates what belongs in the deck.
Use this foundational formula:
“This carousel helps [target audience] understand or execute [specific outcome] by explaining [core mechanism or angle].”
Consider this illustrative model:
- Topic: Content distribution.
- Angle: Repurposing long-form research into visual decks.
- Audience: In-house content managers at software companies.
- Content Promise: “This carousel helps in-house content managers convert technical research papers into five-slide LinkedIn document posts without losing technical nuance.”
This clear boundary makes drafting straightforward. Any slide concept that does not directly support this specific promise must be cut.
Distinguishing topic, angle, evidence, and outcome
To maintain editorial discipline, separate these four structural layers during your planning phase:
- Topic: The broad operational category, such as client reporting or social scheduling.
- Angle: Your specific argument, point of view, or operational lens regarding that category.
- Evidence: The concrete examples, interface walk-throughs, or observations that substantiate your claim.
- Outcome: The exact operational adjustment the reader can make in their own workflow.
Maintaining this clarity keeps your social calendar organized. When you recognize that a calendar is a creative tool, you can map distinct angles across the month without repeating yourself or confusing your audience.
What is the ideal slide-by-slide structure for a sequential post?
While slide counts vary based on topic depth, an eight-slide structure serves as a reliable default template for educational and explanatory content. Each slide must perform a single, unambiguous job.
Slide 1: Hook and content promise
The first slide earns the reader’s attention and sets an explicit expectation for the rest of the deck. It must present a clear focal point, a legible headline, and an immediate indicator of value.
- Primary job: Stop the feed scroll and state what the reader will gain.
- Copy prompt: Present a specific problem, an operational paradox, or a clear promise of utility.
- Visual direction: Use a prominent headline with strong contrast against the background. Avoid cluttered secondary badges, decorative stickers, or generic text like “Swipe to read.”
Slide 2: Context and common friction
The second slide validates why the topic matters now. It describes the common operational headache, the cost of inaction, or the flawed status quo that the reader currently experiences.
- Primary job: Establish relevance and show empathy for the reader’s situation.
- Copy prompt: Describe the specific friction point or common misconception that leads to poor outcomes.
- Visual direction: Use a clean layout with a short supporting paragraph or a simple two-part comparison.
Slide 3: The core principle or mental model
Before jumping into tactical steps, give your reader a framework for thinking about the solution. This slide anchors the technical advice in a clear foundational rule.
- Primary job: Provide the overarching rule or definition that makes the subsequent steps logical.
- Copy prompt: State the primary mechanism in plain, unambiguous terms.
- Visual direction: Highlight a single sentence or display a simple visual relationship between two components.
Slide 4: Step one or first supporting pillar
This card begins the tactical execution. It presents the first concrete action or the initial criterion the reader must apply.
- Primary job: Walk through the first required action.
- Copy prompt: Provide clear instructions for step one, including any necessary constraints.
- Visual direction: Use bold numerical indicators and clean typographic hierarchy so the primary instruction stands out.
Slide 5: Step two or empirical evidence
The fifth card continues the progression or introduces evidence that supports your framework.
- Primary job: Deepen the instruction or demonstrate proof of the concept in action.
- Copy prompt: Explain the subsequent operational step or present supporting documentation.
- Visual direction: Include a structured list, a side-by-side visual element, or an annotated interface element.
Slide 6: Practical application or worked example
Abstract advice often fails without concrete context. This slide shows how the advice looks when applied to a realistic operational scenario.
- Primary job: Demonstrate the theory inside a realistic context.
- Copy prompt: Show a clear before-and-after sample, an illustrative workflow, or a tactical application.
- Visual direction: Label the example clearly. Differentiate purely illustrative examples from documented data.
Slide 7: Common mistake or implementation warning
Even strong processes break down if edge cases are ignored. Use the penultimate slide to highlight a frequent mistake, a common misinterpretation, or a technical limitation.
- Primary job: Prevent implementation errors and address edge cases.
- Copy prompt: Highlight the primary pitfall to avoid when executing the advice.
- Visual direction: Use a clear “Watch out” or “Avoid this” callout box with distinct visual boundaries.
Slide 8: Summary and specific next step
The final card synthesizes the primary lesson and offers a logical, practical next action.
- Primary job: Reinforce the core takeaway and guide the reader toward practical execution.
- Copy prompt: Summarize the central thesis in one sentence and suggest a relevant next step.
- Visual direction: Keep the final card calm and uncluttered. Provide clear text directions rather than aggressive sales graphics.
How do different content types alter the carousel narrative arc?
While the standard eight-slide model works across many topics, different content objectives require different structural arcs. Adapting the framework ensures that your visual structure matches your editorial intent.
The technical how-to arc
When the goal is teaching a repeatable operational skill, structure the deck around chronological prerequisites and procedural clarity:
- Target outcome and intended audience.
- Required tools, assets, or platform prerequisites.
- Preparation and initial configuration.
- Core execution step.
- Verification and quality assurance check.
- Common troubleshooting scenario.
- Final operational result.
- Implementation checklist or reference step.
In a how-to sequence, keep text strictly instructional. Avoid subjective commentary inside the numbered steps, saving personal insights for the post caption.
The structured comparison arc
When helping your audience choose between two workflows, tools, or strategies, use a neutral comparison arc:
- The specific decision or trade-off the reader faces.
- The evaluation criteria that matter most.
- Option A breakdown, including operational strengths and limitations.
- Option B breakdown, including operational strengths and limitations.
- Direct comparison across the standard criteria.
- The primary decision rule based on context and resources.
- Recommended path based on specific organizational needs.
- Summary takeaway and question for peer discussion.
Maintain visual consistency across comparison slides. If Option A uses three bullet points covering speed, cost, and maintenance, Option B must use the exact same categories in the same order.
The myth vs. reality arc
Correcting an industry misconception requires careful deconstruction rather than hostile assertions:
- The widely accepted claim or standard industry advice.
- The direct verdict or counter-position stated clearly.
- Why the original assumption seems correct on the surface.
- The hidden operational flaw or missing context.
- Concrete evidence or reasoning supporting the corrected view.
- The nuance, exception, or edge case where the old rule still applies.
- The revised, accurate operational principle.
- How the reader should update their daily workflow.
Ensure the corrected principle is stated constructively. The goal is to build operational competence, not simply criticize outdated practices.
The illustrative case breakdown arc
Case breakdowns help readers understand how complex initiatives unfold over time:
- The strategic objective or challenge faced.
- Initial constraints, including tooling, bandwidth, or platform limits.
- The chosen operational approach and hypothesis.
- Critical decision point one and the rationale behind it.
- Critical decision point two and how unexpected friction was resolved.
- The documented outcome and operational lessons learned.
- What did not work or areas that remain uncertain.
- Transferable takeaways the reader can apply to their team.
Always distinguish between documented operational models and hypothetical scenarios. Never invent corporate entities or present fabricated performance data as factual case history.
How should you design slides for readability, contrast, and visual hierarchy?
A thoughtful editorial outline fails if the reader cannot read the text on a mobile device. Visual design for social carousels is primarily an exercise in information hierarchy, typography, and legibility.
Establishing strict typographic hierarchy
Mobile screens offer limited visual space. Every slide should feature a maximum of three typographic levels:
- Slide Title or Step Number: The primary signpost that tells the reader what the slide is about. Use high-contrast, bold styling.
- Lead Sentence: The primary insight or instruction for that card. Keep this to one or two concise lines.
- Supporting Detail: Short explanatory text, bulleted points, or data labels. Keep this text large enough to read without zooming.
Limit your layout to two complementary font families: one for structural headers and one for body copy. Using multiple decorative typefaces creates visual noise that distracts from the message.
Adhering to visual accessibility and contrast guidelines
Accessibility is a fundamental editorial requirement, not an optional design polish. If users with visual impairments or varying screen environments cannot read your content, your deck fails.
Apply these core accessibility rules:
- Follow the Web Content Accessibility Guidelines (WCAG) 2.2 standard, which requires a minimum contrast ratio of 4.5:1 for standard text and 3:1 for large text against background surfaces.
- Never rely on color as the sole indicator of meaning. If red indicates an error and green indicates a correct step, pair the colors with explicit text labels, unique shapes, or clear icons.
- Ensure text maintains comfortable padding from the canvas edges. Platform interfaces frequently overlay profile headers, swipe indicators, or UI controls near the borders.
- Provide descriptive alternative text for image-based carousels where the hosting platform supports it. Describe the core insight of the card rather than using generic filler text.
Balancing text density and negative space
A slide is not a blog post. Crowding twelve sentences onto a 1080-pixel square overwhelms the reader and ruins readability.
Follow the one-job-per-slide principle. If a slide contains two distinct operational concepts, split them across two separate cards. Maintain generous whitespace around text blocks to give the reader’s eye a clear visual resting point.
Use the post caption to carry extended technical context, citations, and detailed nuance. The slide introduces and structures the concept, while the caption delivers the deeper textual background.
What are the key platform nuances between Instagram and LinkedIn?
While the core narrative structure applies universally, publishing execution varies significantly across platforms. Failing to account for platform-specific formats can lead to cropped text, blurry graphics, or failed uploads.
Instagram carousel specifications and behaviors
On Instagram, carousels are published as a sequence of native images or videos:
- Aspect Ratios: Instagram supports square (1:1), portrait (4:5), and landscape (1.91:1) aspect ratios, according to documentation compiled by Sprout Social. Portrait (1080 x 1350 pixels) is widely preferred for educational carousels because it occupies maximum vertical space in the mobile feed.
- Slide Limits: The native Instagram mobile application allows up to 20 media items per carousel in recent updates. However, third-party scheduling platforms and developer publishing APIs may enforce different technical limits, often capped at 10 items. Always verify your specific publishing tool’s constraints before building large decks.
- Video Integration: Instagram permits mixing still graphics and short video clips within the same carousel. Ensure that video clips share the exact aspect ratio of the opening image to prevent unexpected automatic letterboxing.
- First Slide Cropping: Instagram displays your carousel cover on your primary profile grid. Design your cover slide so the central 1080 x 1080 pixel square remains visually balanced and readable when cropped on your profile page.
LinkedIn document post specifications and behaviors
On LinkedIn, educational carousels are typically uploaded as PDF document posts rather than multi-image posts:
- Document Format: LinkedIn renders uploaded multi-page PDF documents as swipeable, fullscreen-capable document viewers within the feed.
- Dimensions and Orientation: Standard export dimensions include square (1080 x 1080 pixels) or vertical portrait (1080 x 1350 pixels) formats. Square documents provide consistent presentation across both mobile and desktop feed layouts.
- File Limits: LinkedIn supports document uploads up to 300 pages and 100 MB in file size. However, practical educational decks should rarely exceed 8 to 12 pages to preserve reader focus and completion rates.
- Vector Quality: Export your PDF assets using clean vector typography and compressed images. This keeps your file size well below the platform limit while ensuring razor-sharp text rendering across all screen resolutions.
When managing accounts across multiple networks, maintaining visibility over each destination’s specific formatting requirements is vital. You can manage format-aware scheduling using Faryen’s publishing workspace to ensure each post reaches its target destination without layout errors.
What common carousel publishing mistakes ruin reader engagement?
Even seasoned content teams make recurring tactical errors that undermine their carousel content. Recognizing these pitfalls helps you maintain high editorial quality across every campaign.
Mistake 1: Treating technical limits as editorial targets
The fact that LinkedIn allows 300 document pages or Instagram supports 20 slides does not mean your post should use them. Bloated decks dilute the central message, increase reader drop-off, and waste production time. Keep your deck as short as possible while still delivering a complete, actionable explanation.
Mistake 2: Writing clickbait hooks that fail to deliver
Sensational opening slides that promise impossible results create immediate cynicism. If your cover slide promises a comprehensive framework for team scaling, but the inner slides offer only generic bullet points, the reader will not return. Ensure the value delivered on cards four through seven exceeds the promise made on card one.
Mistake 3: Relying on visual monotony
While visual brand consistency is necessary, repeating the exact same layout across eight consecutive slides creates visual fatigue. When every card looks identical, the reader loses their sense of progression. Vary your layouts intentionally: follow a text-based instruction card with an annotated visual card or a comparison layout to signal forward movement.
Mistake 4: Hiding critical conclusions in the final slide only
Holding the only useful insight until the final card creates a frustrating experience. Viewers who leave on slide four should still walk away with practical value. Deliver incremental utility on every card rather than structuring your deck as an artificial cliffhanger.
Mistake 5: Using disconnected call-to-action prompts
Ending a high-level operational breakdown with a generic “Drop a comment below” feels abrupt and transactional. Align your final call to action with the content of the post. Encourage readers to save the reference framework, share the operational checklist with their engineering lead, or review the referenced documentation.
What do performance metrics actually indicate about carousels?
Industry research frequently highlights carousels as a high-performing post format. For instance, an observational study from Metricool noted an average engagement rate of 10.15% for carousels across their analyzed dataset. Other social benchmark reports suggest carousels can generate significantly higher engagement compared to static standalone images.
However, these figures must be interpreted with professional care:
- Metric Definitions Differ: Engagement rate calculations vary widely across tools. Some divide interactions by total followers, while others divide by total impressions or reach.
- Sample Biases: Published industry studies reflect the specific accounts, industries, and posting frequencies included in that software provider’s user base. They do not represent a universal guarantee for your specific niche.
- Algorithmic Re-delivery: On platforms like Instagram, carousels that are not swiped on the first feed appearance may be shown to the user a second time displaying the second slide. This native delivery mechanism can naturally increase total exposure opportunities without reflecting superior content quality.
Rather than relying on generic industry averages, evaluate carousel performance against your own historical baseline. Look beyond basic likes and track meaningful indicators such as post saves, direct shares, profile visits, and qualified click-throughs. Learning how to read social analytics with context ensures your team optimizes for tangible business utility rather than surface-level vanity metrics.
How do you build an end-to-end production and quality assurance workflow?
A consistent publishing cadence requires a repeatable, step-by-step production workflow. Moving linearly from strategy to final review prevents last-minute redesigns and broken links.
Step 1: Draft the editorial brief
Before designing, complete a brief outlining the audience, the core concept, the content promise, and the required platform format. Script the exact text for all slides in a simple document editor to verify the narrative flow.
Step 2: Conduct an editorial copy review
Read the slide copy aloud to evaluate clarity and pacing. Check that each card performs only one job and that transitions between cards feel natural. Edit ruthlessly to remove unnecessary filler words and corporate jargon.
Step 3: Produce the visual layout
Place the approved copy into your design system or presentation software. Apply consistent typography, verified brand palettes, and generous negative space. Confirm that all text elements meet the 4.5:1 WCAG contrast threshold against their backgrounds.
Step 4: Execute the visual QA review
Export your slides and preview the complete set on a physical mobile device. Perform these specific quality checks:
- Is all text comfortable to read at actual phone screen size?
- Are critical titles or elements obscured by native platform UI overlays?
- Does the sequence make sense if sound or video elements fail to load?
- Are all illustrative diagrams, charts, and before-and-after panels clearly labeled?
Step 5: Finalize post copy and platform metadata
Write your accompanying post caption, including supporting context, source citations, and open discussion points. Prepare your descriptive alternative text strings for each visual card to ensure full accessibility for screen-reader users.
Step 6: Schedule and verify delivery
Schedule the asset through your social management workspace, ensuring the correct destination profiles and format options are selected. Using a dedicated multi-channel platform like Faryen allows teams to manage complex cross-network schedules cleanly without confusing account connections or corrupting multi-image sequences.
Frequently asked questions about carousel planning
How many slides should a social media carousel have?
There is no mandatory slide count. While six to eight slides provide a dependable structure for educational breakdowns, let the complexity of your topic dictate the length. If you can explain an operational step completely in four cards, stop at four. Never add filler cards simply to reach an arbitrary deck size.
Should I design carousels as squares (1:1) or portraits (4:5)?
For Instagram, vertical portrait format (1080 x 1350 pixels) is generally recommended because it occupies more vertical screen area in mobile feeds, reducing immediate distraction from adjacent posts. For LinkedIn document posts, both square (1080 x 1080 pixels) and portrait work well, though square offers consistent framing across both desktop and mobile web interfaces.
How much copy should be placed on a single slide?
Aim for a maximum of 25 to 40 words per slide. A carousel card should be easily scannable within three to five seconds on a mobile screen. If an explanation requires multiple paragraphs, present the primary takeaway on the slide and move the detailed explanatory prose into the post caption.
Can I repurpose the same carousel between Instagram and LinkedIn?
Yes, provided you adapt the final export format to each network’s native requirements. On Instagram, export individual high-resolution PNG or JPG image files. On LinkedIn, compile the slides into a single clean PDF document so it renders through the native document viewer. Always double-check that your aspect ratios and text margins fit both interfaces cleanly.
Sources
- A guide to crafting seamless Instagram carousel posts
- LinkedIn carousel sizes and…
- Instagram Carousel Posts: Complete Guide (Up to 20 Slides in …
- Instagram Carousel Posts: Templates, Sizes & 12 Tips - CreatorFlow
- Social media image sizes for all networks (September 2026)
- Choosing the Best File Type…
- Document Posts, Carousel Ads, and How to Create Them